


Introduction
In a surprising turn of events, Microsoft Excel, the quintessential spreadsheet software, has taken a giant leap forward by introducing Python scripting capabilities. This groundbreaking integration is poised to redefine the way data analysis and manipulation are performed, offering users the ability to seamlessly combine the power of Python with the versatility of Excel. Let’s delve into this remarkable development and explore how it empowers users to usher in a new era of data analytics.
Python in Excel: A Fusion of Strengths
Microsoft’s move to incorporate Python scripting into Excel marks a significant shift in the data analysis landscape. The public preview of this feature is already making waves among Microsoft 365 Insiders in the Beta channel, hinting at its imminent impact. Python, known for its versatility and wide adoption in the data science community, joins forces with Excel, the trusted tool for managing and visualizing data. This amalgamation opens doors to a multitude of possibilities.
Seamless Integration for Data Analysts
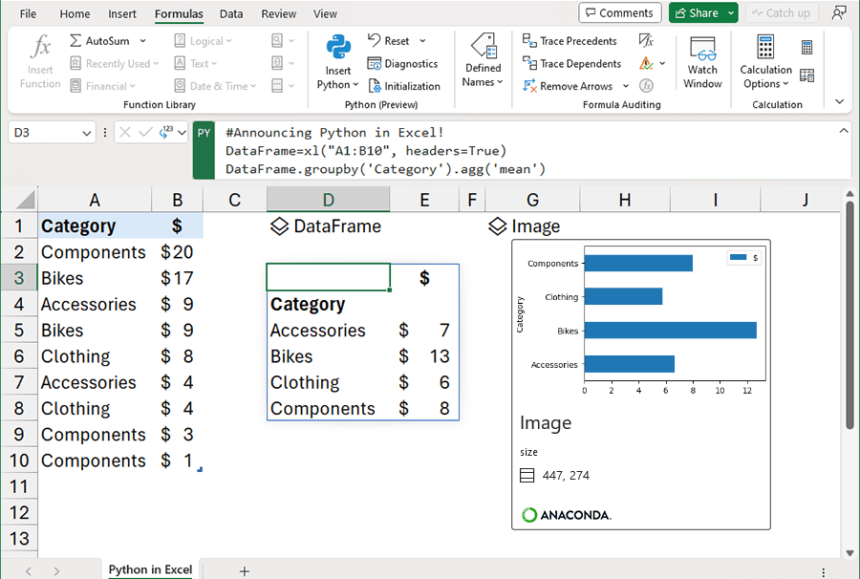
The integration of Python in Excel brings forth a new function, “=PY()”, which acts as a gateway to the world of Python scripting. This ingenious addition lets users embed Python code directly within Excel cells, creating a seamless interface between the two. The results of Python calculations, analyses, and visualizations are seamlessly presented within the Excel worksheet, erasing the boundaries between data analysis and spreadsheet management.

A Cloud-Powered Approach
The real magic lies in how Excel executes Python code. Instead of running scripts locally, Excel leverages Microsoft’s Azure Container Instances to execute Python code in the cloud. This approach offers enhanced security and isolates the Python environment, preventing access to local resources. The cloud-based execution ensures that Excel users can harness Python’s capabilities without the hassle of managing local configurations, thereby streamlining the workflow.
Exploring Python’s Arsenal
With Python in Excel, users have access to an impressive arsenal of libraries, including the data manipulation prowess of “pandas” and the visualization prowess of “Matplotlib.” The fusion of these libraries with Excel’s native functionalities empowers users to perform advanced data manipulations, generate insightful visualizations, and delve into comprehensive statistical analyses – all within the familiar Excel environment.
Unleashing Advanced Visualizations
Python’s powerful visualization libraries, such as Matplotlib and Seaborn, find a new home within Excel. Users can now create intricate visualizations, ranging from conventional bar graphs to specialized plots like heatmaps, violin plots, and swarm plots, directly within their Excel workbooks. This integration bridges the gap between data visualization and data analysis, enabling users to communicate insights effectively.
Empowering Statistical Analysis
The partnership between Python and Excel extends to advanced statistical analyses. Python’s “pandas” and “statsmodels” libraries enable users to perform in-depth statistical tasks directly within Excel cells. This empowers analysts, regardless of their data science expertise, to unravel complex patterns, trends, and correlations in their data, all while leveraging Excel’s user-friendly interface.
Sharing and Collaboration Simplified
One of the standout features of Python in Excel is its compatibility with Excel’s collaborative ecosystem. Users can create Python-powered analyses and visualizations and share them seamlessly with colleagues who primarily use Excel. This seamless sharing ensures that the insights generated from Python analyses can be effectively communicated and collaborated upon within the organization.
Elevating Data Analysis Workflows
Python in Excel is more than a feature; it’s a transformative tool that elevates data analysis workflows to unprecedented heights. This integration empowers Excel users to delve into the world of Python without leaving their familiar environment. As the boundaries between data science and business tools blur, a new generation of data analysts emerges, armed with the ability to derive insights and make informed decisions like never before.
Embarking on the Journey: Python + Excel
Excited to embark on this new data analysis journey? Windows users can dive right in by signing up for Python in Excel through the Microsoft 365 Insider Program. As this feature gradually rolls out to wider audiences, the potential for innovation and growth in data analytics becomes evident. So, why wait? Embrace the fusion of Python and Excel, and unlock the door to a realm of endless possibilities.
Conclusion
The integration of Python scripting in Microsoft Excel marks a pivotal moment in the evolution of data analysis tools. This groundbreaking feature seamlessly merges the analytical capabilities of Python with the familiarity of Excel spreadsheets, providing users with a comprehensive platform to conduct data manipulations, perform advanced statistical analyses, and create intricate visualizations. As the boundaries between data science and spreadsheet management dissolve, a new era of data analytics unfolds, empowering users to extract meaningful insights and make informed decisions with unparalleled efficiency.
Wow! Great Innovation